matplotlib에 이미지를 띄우고 싶다면? 이미지를 imread 등으로 로드한 다음 imshow(image)를 호출하면 된다.
1
2
3
4
5
6
7
8
|
import matplotlib.pyplot as plt

fig, ax = plt.subplots()
ax.set_xlim([0, 1036])
ax.set_ylim([0, 1036])

img = plt.imread("image.png")
ax.imshow(img, extent=[0, 1036, 0, 1036])
|
extend=는 이미지맵의 범위를 설정해준다.
하지만 3D 프로젝션에서는 다음과 같은 오류가 발생한다.
1
2
3
4
5
6
|
import matplotlib.pyplot as plt

fig, ax = plt.subplots(subplot_kw={"projection": "3d"})

img = plt.imread("image.png")
ax.imshow(img, extent=[0, 1036, 0, 1036])
|
NotImplementedError: Axes3D currently only supports the aspect argument 'auto'. You passed in 'equal'.
에러 메시지대로 aspect=가 문제인가 싶어 auto를 넘겨도 보았지만 원하는대로 작동하지 않는다.
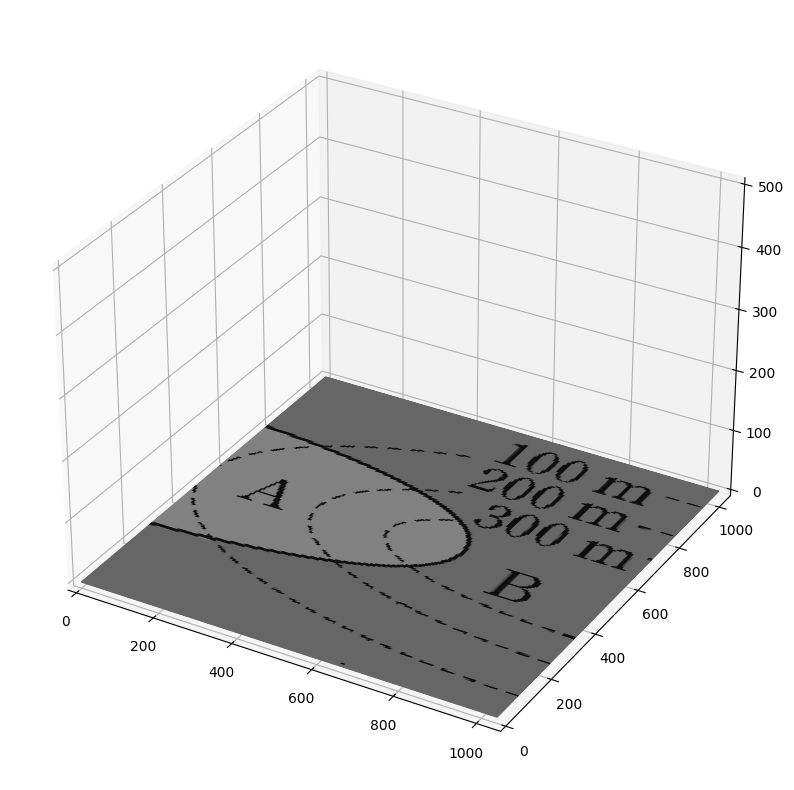
해결책은 imshow 대신 numpy의 ogrid와 plot_surface의 facecolors= 인자를 사용하는 것.
 1
 2
 3
 4
 5
 6
 7
 8
 9
10
11
12
13
14
15
16
17
18
19
20
21
|
import matplotlib.pyplot as plt
import numpy as np

fig, ax = plt.subplots(subplot_kw={"projection": "3d"})

# 축 제한
ax.set_xlim([0, 1036])
ax.set_ylim([0, 1036])
ax.set_zlim([0, 500])

img = plt.imread("image.png")
X, Y = np.ogrid[0:img.shape[0], 0:img.shape[1]]

img = img[-Y,X] # 이미지 뒤집기

Z = np.zeros_like(X)

# rstride=와 cstride=로 화질을 조정할 수 있다.
ax.plot_surface(X, Y, Z, rstride=5, cstride=5, facecolors=img)

plt.show()
|